🛠️ Contributor’s Guide — Working on the Platform
The previous seven modules explained how the platform works. This one is about how you work on it: where the code lives, how the pieces build, how to run it, and — most importantly — how to make a change and prove it works. If you’ve read this far, you already understand the architecture; this module turns that understanding into the confidence to open the editor.
Table of Contents
- Repository Layout
- How Each Piece Builds
- Running the Platform
- Configuration: One File to Rule It
- Recipe: Add a Feature Node
- Recipe: Add a Counter or API Command
- The Debugging Toolkit
- Gotchas Worth Memorizing
- Where to Start Reading
- Key Takeaways
- You’ve Finished the Track
Repository Layout {#layout}
The repository is organized by component, mirroring the three planes:
├── run_ngfw.sh            # the orchestrator / entry point
├── config_files/          # env file + envsubst templates (startup.conf, interfaces)
├── src/
│   ├── plugins/           # custom VPP C plugins — the data-plane brains
│   │   ├── ngfw_decision/ #   policy + steering + CLI + API
│   │   ├── acl/           #   classification → steering tag
│   │   ├── nat/           #   nat44 / nat66
│   │   └── snort/         #   VPP↔Snort plugin + the VPP DAQ module
│   └── mgmt_bridge/        # Java management bridge + JNI native shim
├── python_scripts/        # IPsec control glue (VICI) — setup + runtime
└── extras/
    ├── snort3/            # patched Snort core (detection hooks)
    └── strongswan/        # the kernel-vpp plugin (SAs → VPP)
Two orientation tips:
- Follow a packet to find code. The pipeline order (
acl → ngfw_decision → snort → post-snort → nat → ipsec) is the reading order. Start where the packet enters and move downstream. Readme.txtfiles are gold. Several plugins ship a short changelog/readme (ngfw_decision,acl,nat,snort, the StrongSwan plugin). Read those first — they tell you what changed and why.
How Each Piece Builds {#builds}
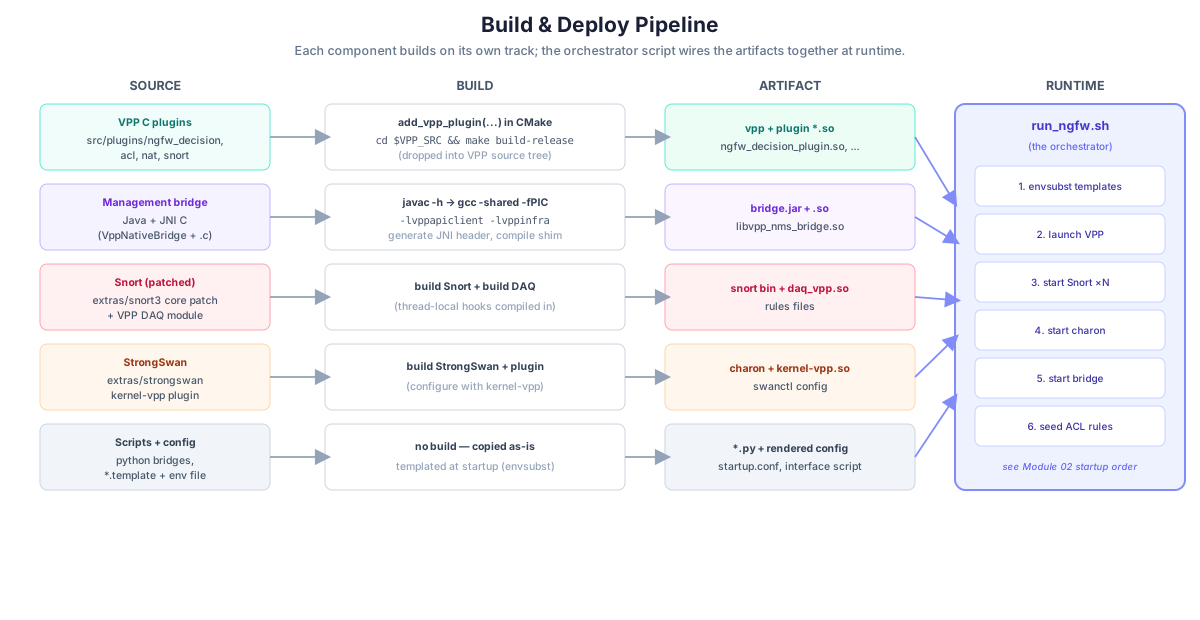
Because it’s a polyglot system, there isn’t one build — there’s one per component. They’re independent tracks that converge at runtime.
 {:class=“diagram-img”}
Each component builds on its own track into an artifact; run_ngfw.sh wires the artifacts together at startup.
VPP plugins (C)
A VPP plugin lives inside the VPP source tree ($VPP_SRC/src/plugins/<name>/) and is declared with one CMake macro:
add_vpp_plugin(ngfw_decision
  SOURCES        ngfw_decision.c ngfw_decision_cli.c ngfw_decision_ip6.c
                 ipsec_commands.c access_policy_commands.c nat_commands.c
                 swanctl_commands.c ngfw_stats_commands.c
  INSTALL_HEADERS ngfw_decision.h ...
  API_FILES      ngfw_decision.api
)
You build the whole of VPP (which builds your plugin) with make build (debug) or make build-release (optimized) from the VPP source root. API_FILES runs the .api definitions through VPP’s code generator to produce the message marshalling — that’s where the ngfw_counter_clear message from Module 07 comes from.
The management bridge (Java + JNI C)
Two artifacts: the Java jar and the native shim. The native shim build:
javac -h .on theVppNativeBridgeclass generates the JNI header (the C prototypes matching the Javanativemethods).gcc -shared -fPIC ... -lvppapiclient -lvppinfra -lpthreadcompiles the shim intolibvpp_nms_bridge.so, linking VPP’s client libraries.
The Java sources build with the project’s Java toolchain into the bridge jar; at runtime the JVM loads the .so via java.library.path.
Snort and StrongSwan
These build largely as their upstream projects do, plus the custom bits: the patched Snort detection hooks + the VPP DAQ module (Module 05), and StrongSwan configured with the kernel-vpp plugin (Module 06).
Running the Platform {#running}
run_ngfw.sh is the single entry point, and its startup order is exactly the dependency chain from Module 02: render config → VPP → Snort → charon → management bridge → seed ACLs → tail a log to stay alive. It’s designed to run as a container/appliance entry point.
To bring the box up, you (or the container) run that script; to bring it down, you stop the processes it started. Everything the script does is readable top-to-bottom — it’s the best “what actually happens on boot” reference in the repo.
Configuration: One File to Rule It {#config}
You almost never edit source to deploy differently — you edit the environment file. The templates in config_files/ carry ${PLACEHOLDER} variables that envsubst fills from that env file at startup. The knobs you’ll touch most:
| Setting | Controls |
|---|---|
| CPU pinning (main core, worker cores, Snort base core) | which cores each thread owns |
| PCI addresses + interface names | which NICs VPP binds via DPDK |
| VLAN IDs + interface addresses | the logical in / VPN-out / internet-out interfaces |
| Number of Snort instances + queue size | inspection parallelism |
| NAT session limits | NAT table sizing |
| Tunnel / IPsec parameters | the VPN endpoints |
When you stand this up on new hardware, start here. Wrong core pinning or PCI addresses is the #1 first-run problem — not a code bug. Match the env file to the machine before suspecting anything else.
Recipe: Add a Feature Node {#add-node}
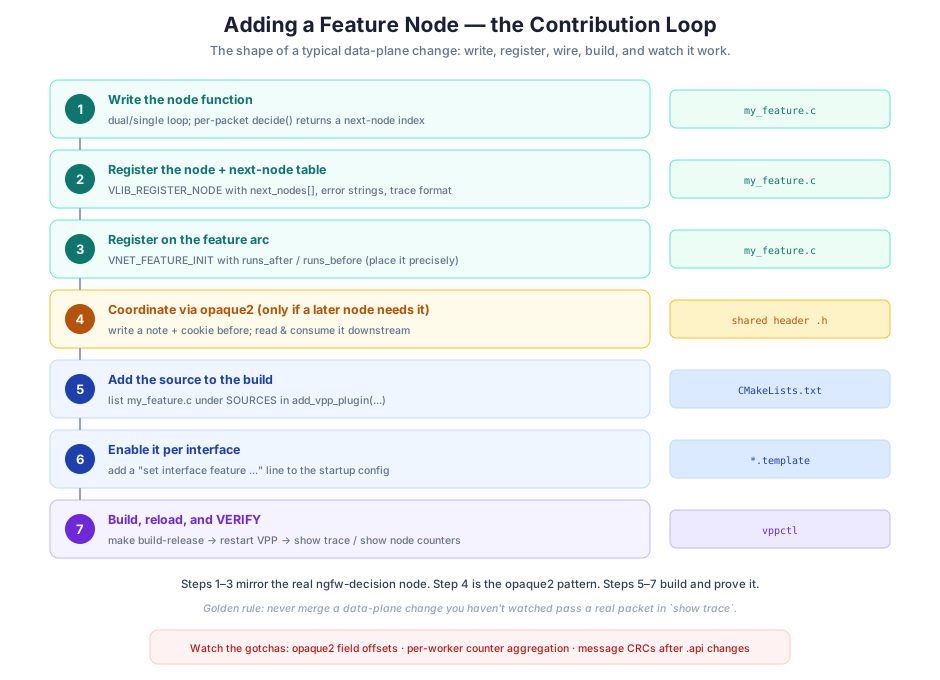
This is the most common data-plane contribution, and you already saw the concept in Module 03. Here it is as a concrete workflow with the files you touch:
 {:class=“diagram-img”}
Steps 1–3 mirror the real decision node; step 4 is the opaque2 pattern; steps 5–7 build and prove it.
- Write the node function — the dual/single-loop skeleton; put your per-packet logic in
decide(), returning a next-node index. (my_feature.c) - Register the node —
VLIB_REGISTER_NODEwith itsnext_nodes[]table, error strings, and a trace formatter. (my_feature.c) - Register on the arc —
VNET_FEATURE_INITwith the rightruns_after/runs_beforeso it lands exactly where you want relative to ACL, Snort, and NAT. (my_feature.c) - Coordinate via
opaque2(only if a downstream node needs your decision) — write a struct + cookie before; read and consume it after. (shared.h) - Add the source to the build — list
my_feature.cunderSOURCESinadd_vpp_plugin(...). (CMakeLists.txt) - Enable it per interface — add a
set interface feature ...line to the startup config template. (*.template) - Build, reload, and verify —
make build-release, restart VPP, then watch a packet withshow traceand confirm counts withshow node counters. (vppctl)
Step 7 is not optional. A data-plane change isn’t done until you’ve watched a real packet take the new path in show trace.
Recipe: Add a Counter or API Command {#add-api}
To expose something new to the management plane, the path spans the whole stack — a good exercise for understanding it end to end:
- Emit a counter in your node (
vlib_node_increment_counter, or a combined counter) — Module 03. - If you need an action (not just a read), define a message in the plugin’s
.apifile and write its handler — likengfw_counter_clear. - Rebuild so the API code generator regenerates the message table (and its CRC).
- On the management side, read the counter through the stats segment (aggregating per-worker!) or send the command through the binary API — Module 07.
- Add a per-feature reporter method so the new metric is served northbound.
The Debugging Toolkit {#debugging}
VPP’s introspection is your best friend. Keep these in muscle memory:
| Command | Use it to… |
|---|---|
trace add dpdk-input 50 + show trace | Watch real packets walk the graph, node by node, with each node’s decision. |
show node counters | See per-node tallies — passed / dropped / to-Snort / to-IPsec. |
show runtime | Find hot nodes (clocks-per-packet, vectors processed). |
show interface features <iface> | Confirm your feature is enabled, and in what order. |
show snort counters / show snort stats | IPS verdicts, SIDs, AppIDs. |
ngfw_swanctl show sas | Live IKE/child SA state (via the Python bridge). |
show errors | A quick tally of every error-drop reason. |
And the logs, one per component: VPP’s log, each Snort instance’s output, charon’s log, the Python bridge logs, and the management bridge log. When something’s wrong, the loop is always the same: reproduce → show trace / show node counters → read the one relevant log. You built a glass box; use it.
Gotchas Worth Memorizing {#gotchas}
Every one of these is a real constraint from the code, and each has bitten someone:
opaque2field offsets are load-bearing. The ACL tag must stay at offset 0 so it doesn’t collide with the firewall’s note; a compile-time assertion guards it. Don’t reorder that struct.- Counters are per-worker. A “total” is the sum across worker threads. Forget to aggregate and your numbers read low. (Module 07)
- API changes shift the CRC. Edit a
.apimessage and its CRC changes; any client resolving it by CRC must be rebuilt too, or the message won’t match. - The cookie prevents cross-talk. The post-Snort node only acts on packets carrying the
0xABcookie — because packets can reach Snort by other paths. Preserve that check. - Rekey changes SA indices. IPsec bindings must be refreshed on rekey, not set once. (Module 06)
- Fail-closed vs fail-open is a real choice. Snort’s
on-disconnectand the IPsec “drop if no SA” behavior are deliberate safety defaults — understand them before changing them. - Config before code. On a bad first run, check CPU pinning, PCI addresses, and interface names in the env file before assuming a bug.
Where to Start Reading {#start-reading}
If you want to read your way in rather than jump to a task, this order tracks the modules and builds understanding fastest:
run_ngfw.sh— the whole system on one page.- The config templates + env file — what’s configurable and how interfaces/arcs are set up.
ngfw_decision.hthenngfw_decision.c— the design comment at the top of the header is the single best architecture doc in the repo; the.cis the pipeline in action.acl/types.h— the steering tags that drive the decision node.snort/Readme.txtand the DAQ shared header — the IPS bridge.- The Python bridges + the StrongSwan plugin readme — the IPsec control plane.
- The JNI shim — the management read/command paths.
Key Takeaways {#key-takeaways}
- The repo is organized by component along the three planes; the pipeline order is the reading order, and the
Readme.txtfiles are the fastest orientation. - Each component has its own build — VPP plugins via
add_vpp_pluginin the VPP tree; the bridge viajavac -h+gcc -shared; Snort and StrongSwan as patched upstreams — converging atrun_ngfw.sh. - Deployment is configuration, not code: the env file drives templated startup (cores, NICs, VLANs, instance counts).
- Adding a feature node is a fixed seven-step loop; adding a counter/API command spans node →
.api→ management. - Verify by watching:
show trace,show node counters,show runtime,show snort,ngfw_swanctl— never merge a data-plane change you haven’t seen work on a real packet. - Keep the gotchas in mind —
opaque2offsets, per-worker counters, API CRCs, the cookie, rekey binding, fail-closed defaults, config-before-code.
You’ve Finished the Track {#finished}
You started with “what is a firewall?” and ended knowing how a real one is built: a VPP data plane running custom C nodes on a feature arc, a Snort IPS fed over shared memory, StrongSwan negotiating IPsec that VPP encrypts at line rate, and a management bridge surfacing it all — orchestrated by one script and configured by one file.
The single idea that ties it together, seen from every angle now:
A fast C data plane, proven engines beside it, and thin, well-defined bridges connecting everything — buffer metadata between nodes, shared memory to Snort, VICI to StrongSwan, JNI to the manager.
That pattern isn’t unique to this platform; it’s how most high-performance network software is built. You’re ready to read the code, trace a packet, and make your first change.