📊 Management Plane — Turning Packets into Dashboards
We’ve traced packets through the data plane (Modules 03–04), watched the IPS inspect them (Module 05), and encrypted them over VPN (Module 06). Every one of those steps bumped a counter inside VPP. This final mechanism module answers: how does all that per-packet activity become something an operator can see — a dashboard, an alarm, a number on a screen?
The answer is the management plane: a bridge that reads VPP’s counters and serves them northbound to a management system. It’s the one plane that never touches a packet — and understanding it also teaches you the two standard ways anything talks to VPP from outside.
Table of Contents
- What the Management Plane Does
- The Big Picture
- The Language Gap: Java Meets C
- Two Ways to Talk to VPP
- The Read Path: the Stats Segment
- The Command Path: the Binary API
- Per-Feature Reporters
- Alarms & Northbound Output
- Why It’s a Separate Process
- Key Takeaways
- What’s Next
What the Management Plane Does {#what-it-does}
In telecom, the discipline of running network equipment is often called OAM — Operations, Administration, and Maintenance. Concretely, a management plane needs to:
- Expose metrics — packet/byte counts, per-rule hits, IPS verdicts, tunnel status — to a central Network Management System (NMS).
- Raise alarms when something goes wrong — a resource exhausted, a threshold crossed, a component unreachable.
- Retain history — ship events to a store so they can be searched, graphed, and audited.
- Accept control actions — e.g. reset counters.
None of this happens on the packet hot path. The management plane observes and administers the box from the side.
The Big Picture {#big-picture}
 {:class=“diagram-img”}
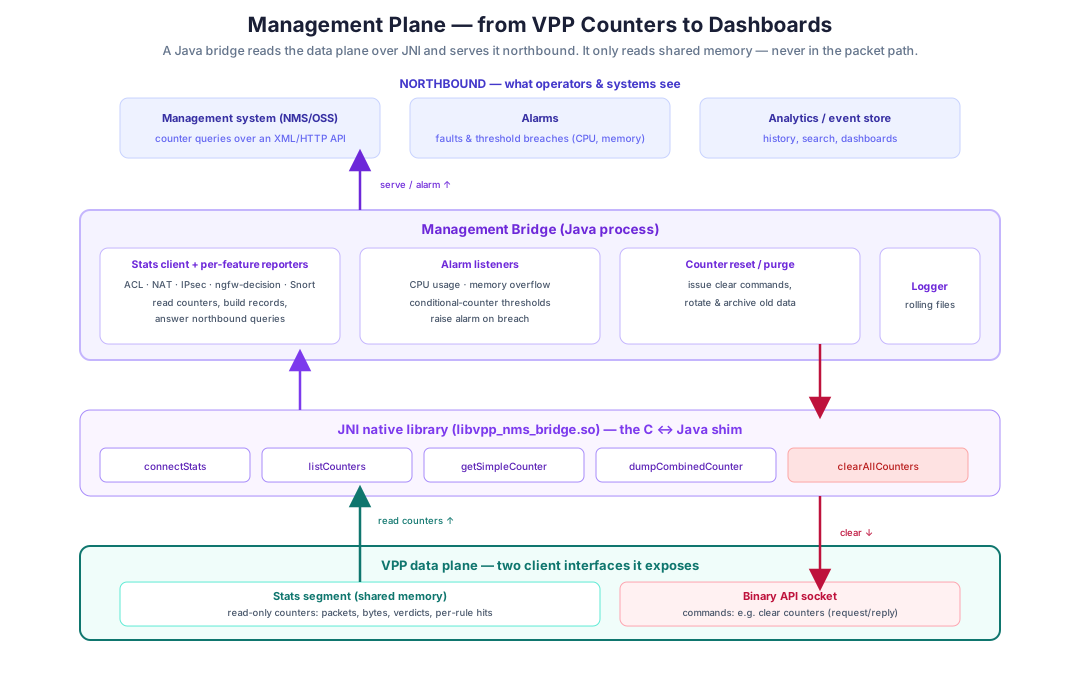
A Java bridge sits above VPP. It reads counters through a JNI shim and serves them northbound as metrics, alarms, and stored events. The read path (up) uses the stats segment; the command path (down) uses the binary API.
Reading bottom-to-top: VPP exposes counters; a JNI native library bridges C to Java; the Java management bridge turns raw counters into per-feature records, watches for alarm conditions, and serves everything northbound. Let’s build it up layer by layer.
The Language Gap: Java Meets C {#language-gap}
Here’s the immediate puzzle: VPP is a C program exposing C client libraries, but the management bridge is written in Java (chosen because the northbound management ecosystem — servers, alarm frameworks, clients — is a Java world). Java can’t call C functions directly.
The bridge across that gap is JNI (Java Native Interface) — the standard mechanism for Java to call into native code. The platform ships a small native library (libvpp_nms_bridge.so) that:
- links against VPP’s C client libraries,
- exposes a handful of plain methods to Java (
connectStats,listCounters,getSimpleCounter,dumpCombinedCounter,clearAllCounters), - and does the C-side work behind each one.
On the Java side, a VppNativeBridge class declares those as native methods; calling them jumps into the C library. So the data flow across the language boundary is: Java VppNativeBridge → JNI → VPP C client → VPP.
One subtle detail worth knowing: VPP’s memory infrastructure expects a heap attached to the calling thread. But JVM threads aren’t VPP threads, so the native code attaches a small VPP heap on first use per thread (an
ensure_vpp_heap()helper). It’s the kind of impedance-mismatch glue that shows up whenever you bolt two runtimes together — worth recognizing so it doesn’t mystify you in the source.
Two Ways to Talk to VPP {#two-ways}
The native library uses two different VPP client interfaces, and the distinction is genuinely useful knowledge — it applies to any VPP integration, not just this one.
 {:class=“diagram-img”}
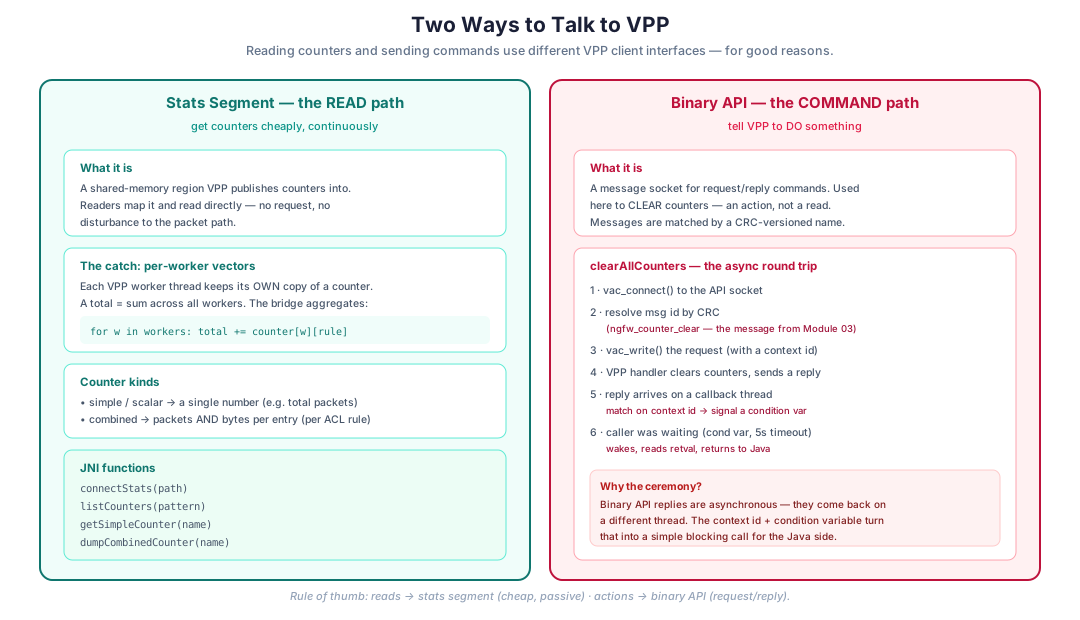
Reads use the stats segment (cheap, passive, shared memory). Commands use the binary API (request/reply message socket).
The rule of thumb:
- Reading counters → the stats segment. Passive, cheap, continuous.
- Telling VPP to do something → the binary API. Request/reply, for actions.
The Read Path: the Stats Segment {#read-path}
VPP publishes all its counters into a stats segment — a shared-memory region that clients simply map and read. There’s no request/response and no lock on the data plane; the reader just looks at memory VPP is already updating. That’s what makes it cheap enough to poll continuously.
The native library offers a few operations over it:
connectStats(path)— attach to the stats segment socket.listCounters(pattern)— enumerate counter names matching a pattern (VPP exposes hundreds).getSimpleCounter(name)— read a simple/scalar counter (a single number, e.g. total packets).dumpCombinedCounter(name)— read a combined counter, which carries packets and bytes per entry (used, for example, for per-ACL-rule stats).
The per-worker catch
There’s one thing you must understand about VPP counters, and it trips up everyone the first time: each VPP worker thread keeps its own copy of every counter. This is deliberate — per-core counters avoid the cross-core contention that a single shared counter would cause on the hot path (the lock-free, per-core-state principle from Module 03).
The consequence: a “total” isn’t a single value — it’s the sum across all workers. The native code aggregates before handing a number back to Java:
/* combined counter: sum packets & bytes across every worker thread */
for (w = 0; w < num_workers; w++)
    for (r = 0; r < num_rules; r++) {
        total[r].packets += counter[w][r].packets;
        total[r].bytes   += counter[w][r].bytes;
    }
If you ever see a counter that reads “too low,” a forgotten per-worker aggregation is the usual culprit.
The Command Path: the Binary API {#command-path}
Reading is passive; clearing counters is an action, and actions go through VPP’s binary API — a message socket where you send a request and get a reply. This is the same API that VPP’s own tools use, and it’s how you’d invoke any custom plugin action.
Recall from Module 03 that the ngfw_decision plugin defined a custom API message, ngfw_counter_clear, with a handler that resets its counters. The management bridge is the client that sends that message. The round trip (clearAllCounters) is more involved than a read because binary-API replies are asynchronous:
vac_connect()to the API socket.- Resolve the message id by CRC. VPP identifies messages by a name+CRC so client and server can’t disagree on the message layout across versions — a nice built-in guard.
vac_write()the request, tagged with a context id (a token to match the reply to this request).- VPP runs the handler (clears the counters) and sends a reply.
- The reply arrives on a callback thread — a different thread from the caller. The callback checks the context id and, if it matches, signals a condition variable.
- The caller was blocked on that condition variable (with a 5-second timeout). It wakes, reads the return value, and hands it back to Java.
That “context id + condition variable” dance is the standard pattern for turning an async reply into a synchronous call: the caller looks like it just did clearAllCounters() and got a result, while under the hood a separate thread received the reply and woke it. Recognizing this pattern is worth more than the specific code — you’ll see it any time a request/reply protocol has to present a blocking API.
Per-Feature Reporters {#reporters}
Raw counters aren’t very meaningful on their own — “counter #4173 = 91,224” tells an operator nothing. So the Java layer has a stats reporter per data-plane feature, each of which knows which counters belong to its feature and what they mean:
- an ACL reporter (per-rule packet/byte hits),
- a NAT reporter (session/translation stats),
- an IPsec reporter (tunnel counters),
- an
ngfw_decisionreporter (pass / drop / to-Snort / to-IPsec — the very counters you saw the decision node increment in Module 03), - a Snort reporter (verdicts, and the SID/AppID telemetry from Module 05).
Each reporter reads its counters via the JNI bridge, aggregates across workers, and turns them into structured records the northbound side can serve (the platform formats these as XML for its management protocol). This is a clean, extensible shape: add a new data-plane feature, add a reporter that knows its counters — the plumbing underneath doesn’t change. It mirrors the “one feature, one node” extensibility of the data plane itself.
Alarms & Northbound Output {#alarms}
Beyond metrics, the bridge actively watches for trouble. Dedicated listeners monitor conditions like CPU usage and memory pressure, plus threshold rules on counters (e.g. “alarm if drops exceed X”). When a condition is breached, the bridge raises an alarm to the management system rather than waiting to be polled — the difference between “you asked, here’s the number” and “something is wrong, here’s a fault.”
The northbound side has three kinds of output:
- Metrics on demand — the NMS queries counters (via the platform’s XML/HTTP request handlers) and gets structured answers.
- Alarms — fault and threshold notifications pushed to the management system.
- Stored events — shipped to an analytics/search datastore for history, dashboards, and audit.
There’s also housekeeping you’d expect from a long-running collector: counter reset/purge tasks and rolling-file logging with archiving, so the box doesn’t fill its disk.
Why It’s a Separate Process {#separate-process}
The same reasoning from Module 02 applies, and it’s worth restating now that you’ve seen the mechanism:
- Zero data-plane risk. The bridge only reads shared memory and occasionally sends one API message. If it hangs, crashes, or is restarted for an upgrade, not a single packet is affected. You could not say that if metrics collection ran inside VPP’s worker loop.
- Right tool for the job. Northbound integration — management protocols, alarm frameworks, datastore clients — is a mature Java ecosystem. Keeping it in Java, in its own process, lets it use that ecosystem without dragging a JVM into the packet engine.
- Independent lifecycle. Management logic changes far more often than the data plane. Isolating it means those changes never touch the fast path.
The JNI shim is the price of admission: a thin, well-scoped bridge so the Java world can read the C world safely. That’s the recurring shape of the entire platform — a fast C data plane, proven engines beside it, and thin bridges connecting everything (buffer metadata to link nodes, shared memory to Snort, VICI to StrongSwan, JNI to the manager).
Key Takeaways {#key-takeaways}
- The management plane exposes metrics, raises alarms, retains history, and accepts control actions — all off the packet path.
- It’s a Java process because the northbound ecosystem is Java; a JNI native library (
libvpp_nms_bridge.so) bridges Java to VPP’s C client libraries. - VPP offers two client interfaces: the stats segment (shared-memory, read counters cheaply) and the binary API (request/reply, for commands).
- VPP counters are per-worker, so a total is the sum across worker threads — the native code aggregates before returning a value.
- Clearing counters uses the binary API and the custom
ngfw_counter_clearmessage; its async reply is turned into a blocking call via a context id + condition variable. - Per-feature reporters (ACL, NAT, IPsec, decision, Snort) give raw counters meaning and format them northbound; alarm listeners push faults proactively.
- Running it as a separate process means management can fail or be upgraded without touching the data plane — the platform’s consistent design principle.
What’s Next {#whats-next}
That completes the tour of all three planes and every major bridge. The final module steps back from how it works to how you work on it: a contributor’s guide — where the code lives, how to build and run the platform, how to add a feature node, and how to debug it — so you can start making changes with confidence.